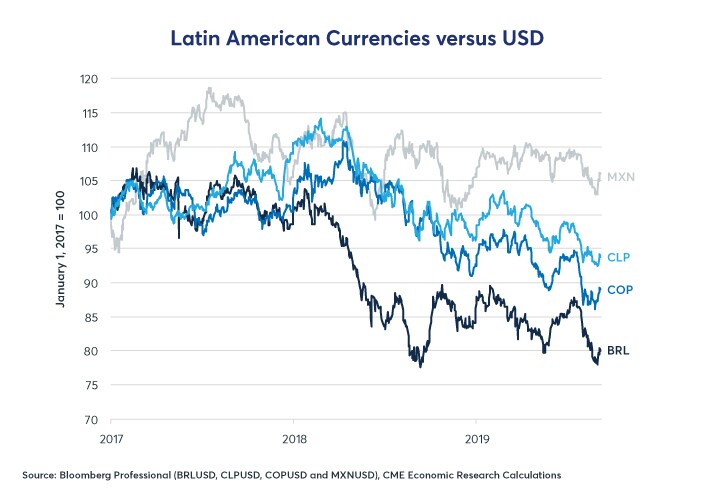
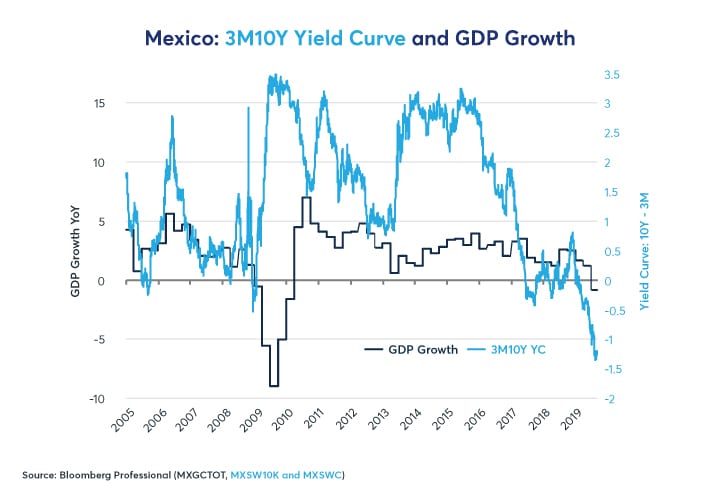
However, the wheels are coming off Mexico’s economic expansion. Under pressure from tight monetary policy, its yield curve has inverted, and year-over-year GDP growth has turned negative (Figure 2). What’s more is that Mexico’s yield curve has inverted even further the past few months and might be presaging a deep economic downturn.
How Mexico and the rest of Latin America fare in the next few years will depend upon several factors including:
- Reliance on natural resource exports to China, which vary significantly across the region.
- Exposure to the economic cycles in the US and Europe.
- Domestic economic factors, including levels of debt and debt-service ratios.
- Central bank policy.
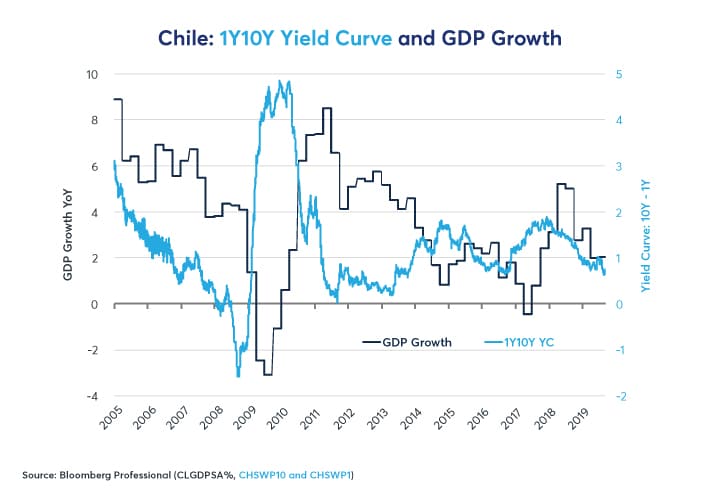
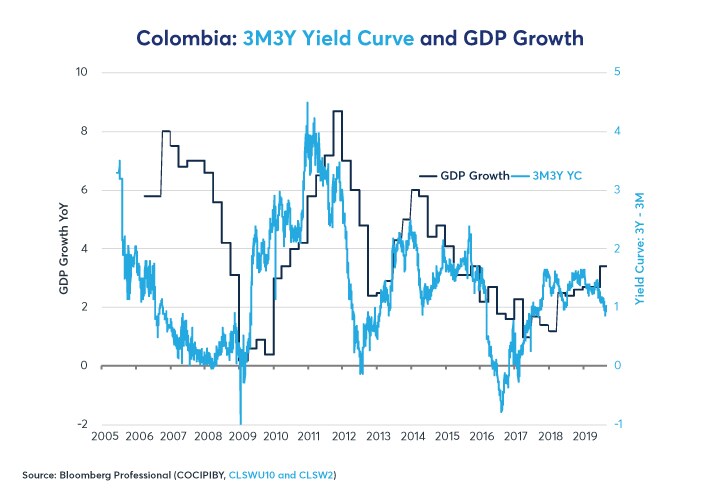
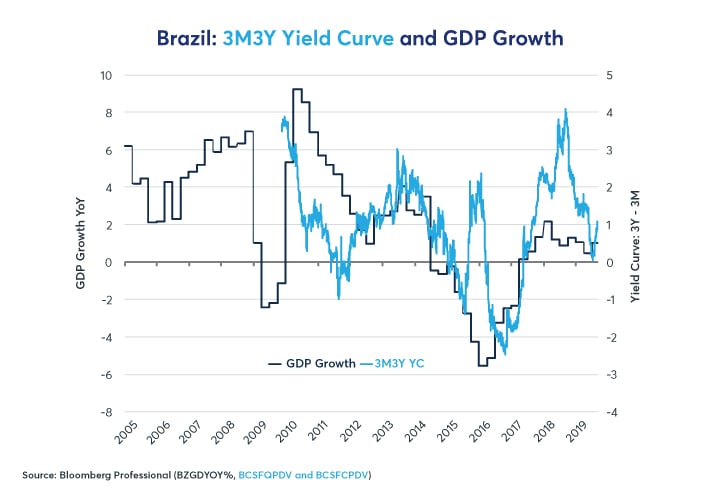
The good news, for the moment, is that yield curves in Brazil, Chile and Colombia are not pointing to a downturn. Chile and Colombia’s yield curves are consistent with a slightly slower pace of growth (Figure 3 and 4), while Brazil’s continues to point towards a very modest economic recovery from the deep recession in 2014-16 that the economy has not fully recovered from (Figure 5). That said, all three of these nations rely a great deal on exports of raw materials to China. As such, the fate of their economies and currencies is very much bound to China.
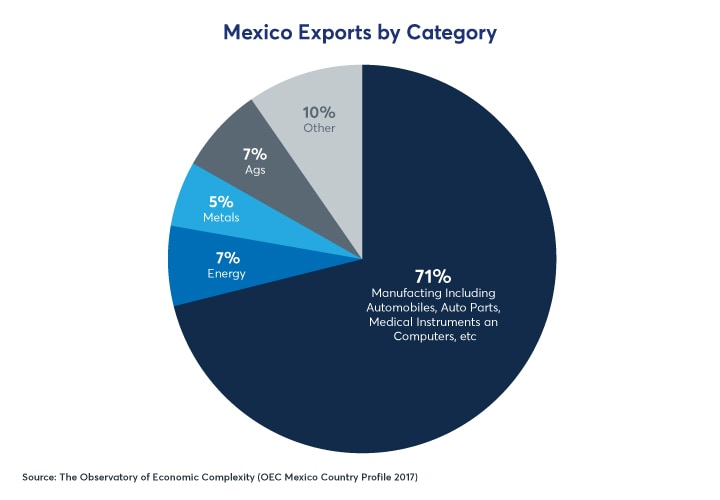
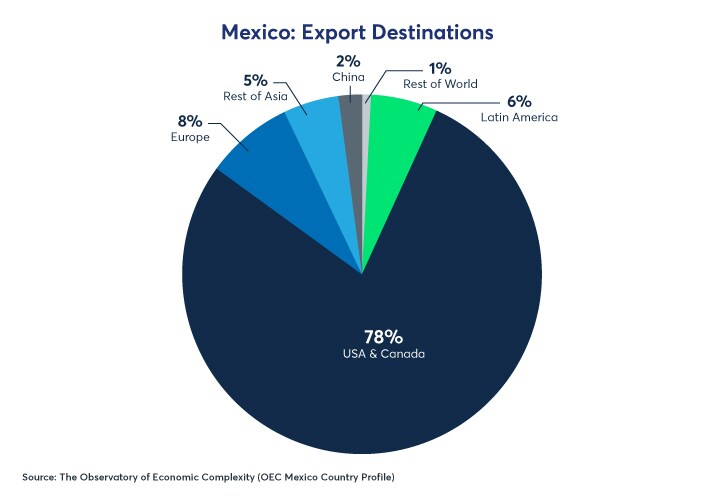
The reason why Mexico avoided trouble when China’s economy slowed and commodity prices collapsed in 2014-16 is simple: Mexico isn’t much of a commodity exporter. Its exports are overwhelmingly manufactured goods (Figure 6). Moreover, it sends most of its exports (73%) to the US and another 5% to Canada (Figure 7). Only 2.1% go to China. As such, China is mostly a competitor and, increasingly, a partner. Chinese investment flows into Mexico are rising and some of the increase may be spurred by the protracted Sino-US trade dispute. Given US tariffs of 10-25% on Chinese goods, many observers assume that production taking in place in China could be delocalized to places like Indonesia, the Philippines and Vietnam to avoid US tariffs. Mexico, with its strong manufacturing base, relatively low-cost labor and proximity to the US, is also an attractive alternative.
While Mexico benefitted from its proximity to the US during the long American expansion that began in late 2009, the combination of tighter policy from both the Federal Reserve and Banco de Mexico is straining credit growth. Any slowing of economic growth in the US would be unwelcome news for Mexico. Given the tightness of US monetary policy, the flatness of the US yield curve, the fading impact of tax cuts, and the trade war, it wouldn’t be surprising to see US growth downshift from the 3% range closer to 1-1.5%. If so, this will be unwelcome news south of the border.
The key thing to watch is US credit spreads. The yield curve has delivered its verdict: both Mexico and the US are heading towards a sharp slowdown. While the yield curve is the best available long-term (1-2 years in advance) indicator, credit spreads are the best near-term signal. Wider credit spreads in the US will be toxic for Mexico. They haven’t widened too much yet, but anyone exposed to Mexican assets should stay alert.
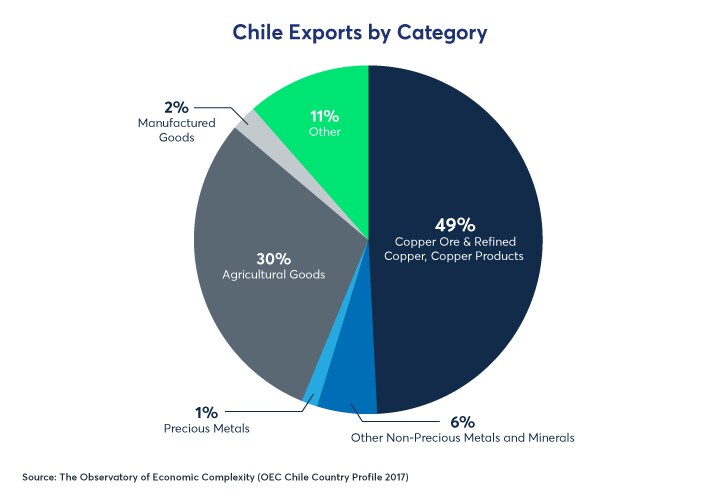
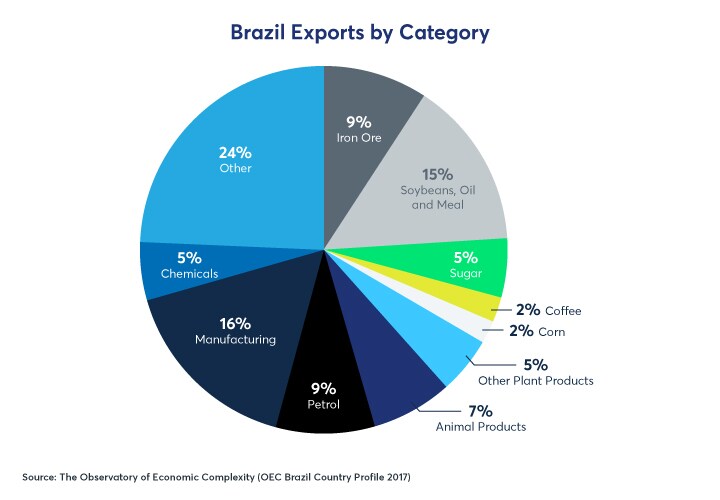
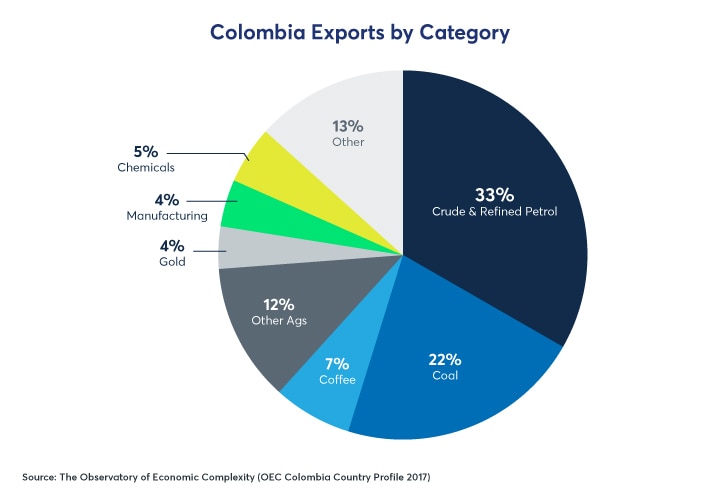
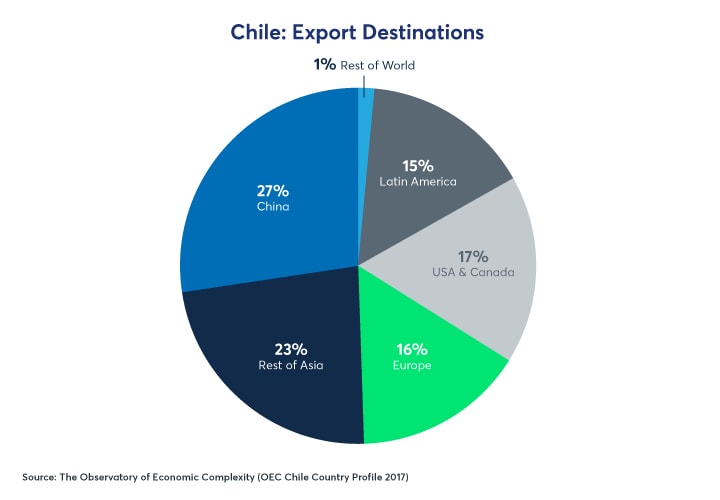
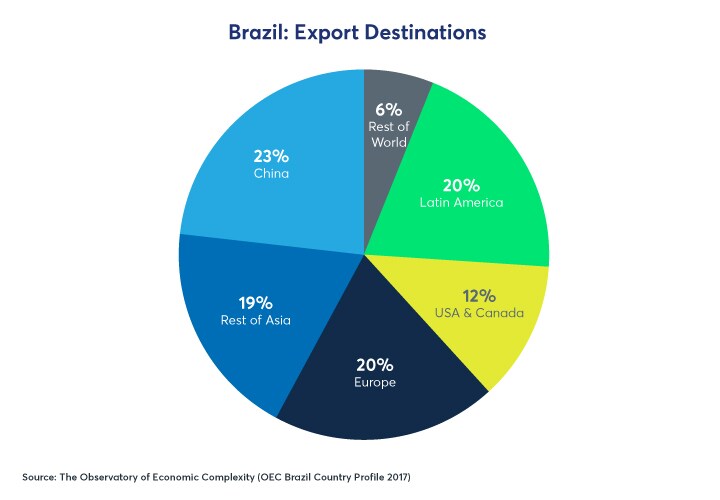
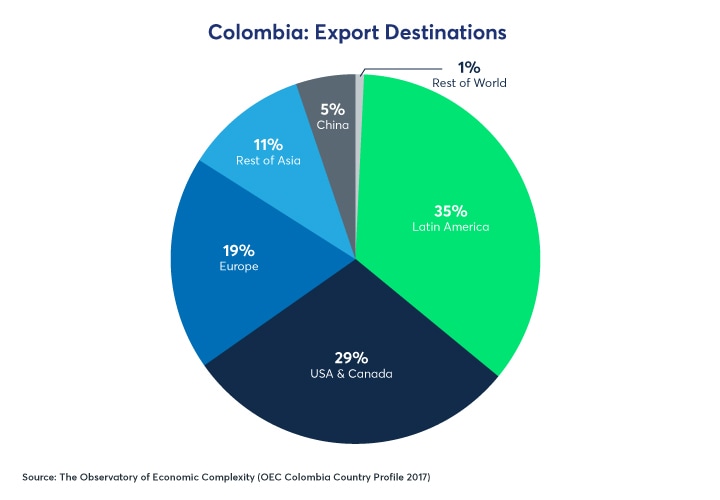
In contrast with Mexico, exports from Latin America’s other big economies rely to a much greater extent on resource extraction and agriculture (Figures 8-10). Moreover, Brazil and Chile are especially reliant on exports to China (Figure 11 and 12) while Colombia has a diversified set of export markets (Figure 13).
China and Latin America
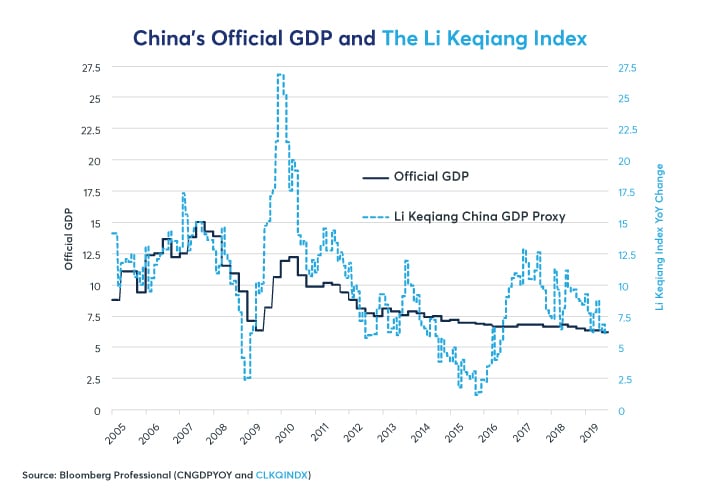
Determining the impact of Chinese growth on Latin America requires choosing the appropriate measure of Chinese economic growth. China’s official GDP isn’t much help when evaluating future conditions for Latin America’s key commodity exports. With an increasingly diversified economy, China’s GDP has been extremely stable for the past seven years, always growing between 6.2% and 7.2% and surprisingly rarely deviating from the consensus.
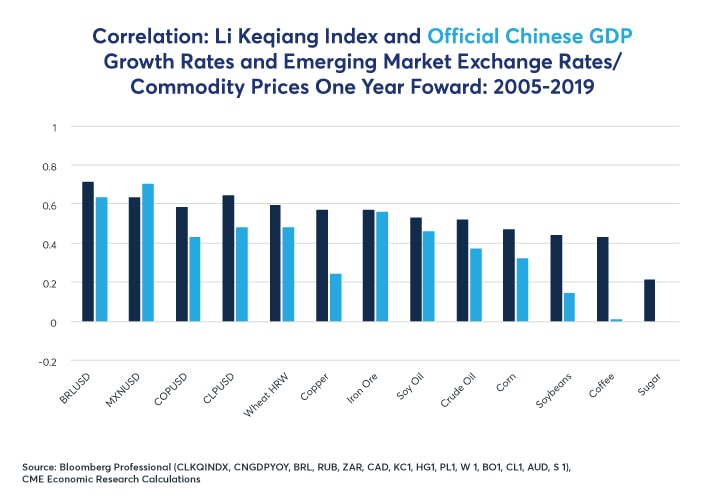
The “Li Keqiang” index offers a much more Latin America-relevant look at Chinese economic growth. It focuses on three areas: changes in electricity use, bank loans and rail freight volumes. It shows a much greater degree of variation in Chinese industrial growth (Figure 14). It’s the growth in Chinese industry, and not services, that is the primary motor of commodity demand and commodity prices. It correlates highly with nearly every major Latin American commodity export, including copper, coffee, cotton, cocoa, sugar, soybean and soy oil as well as with the currencies themselves (Figure 15). What’s more is that this alternative measure of Chinese growth tends to lead movements in LATAM currencies and commodity export prices by up to one year in advance.
As such, the degree to which China slows will play a big role in the fate of Latin America’s currencies. By our estimate, US tariffs will shave more than 0.5% of Chinese GDP (and will also reduce US growth by a few tenths of one percent. With the possible exception of Mexico, which might benefit from the delocalizing of some production currently located in China, the rest of Latin America has little to gain from this trade dispute. Even the Mexican peso, however, appears to be influenced by variations in China’s growth rate, perhaps indirectly and because of movements in competing currencies.
China has many means at its disposal to offset the negative impacts of the trade war. It has been cutting its reserve requirement ratio – a relatively benign way of encouraging domestic credit growth that, on balance, should be positive for Latin America’s exports. However, it has also allowed its currency to slide and LATAM currencies appear to be falling in anticipation of further declines in the value of the renminbi.
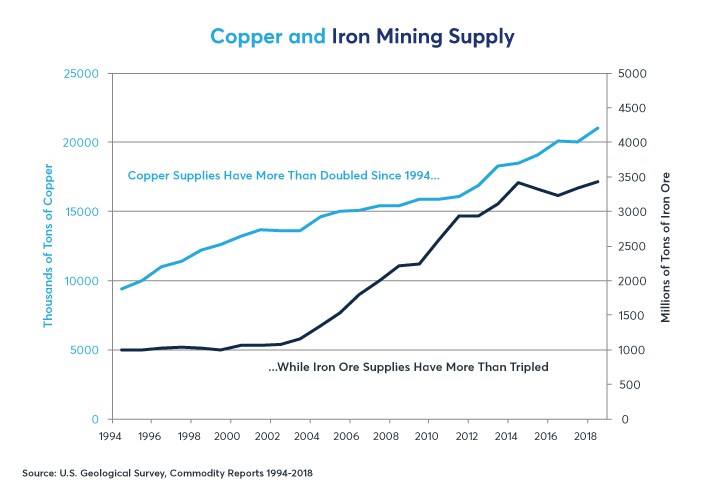
Outside of the trade war, China’s economy has plenty of other issues. Exceedingly high levels of debt are making the economy less responsive to stimulus efforts. Moreover, between now and 2030, the labor force will likely shrink by 5%. This may limit demand growth for commodities, which is particularly bad news for Latin America’s exports of industrial metals. Global production of iron ore (Brazil’s biggest export after soybeans) has tripled since 1994, while production of copper (Chile’s dominant export) has more than doubled (Figure 16). Investors in these sectors could take a hit if China continues to slow because of trade disputes, debt or demographics.
Debt and Latin America
“Latin America” and “debt” were terms that sent shockwaves through markets in the early 1980s when a regional debt crisis led to a decades-long depression that the region didn’t fully recover from until after 2000. The good news is that except for Argentina, most of Latin America’s debt is now domestically denominated and, hence, relatively immune from the early-1980s-style currency collapses. As any Japanese, European or American can explain, “domestically-denominated debt” does not mean “debt without consequence.”
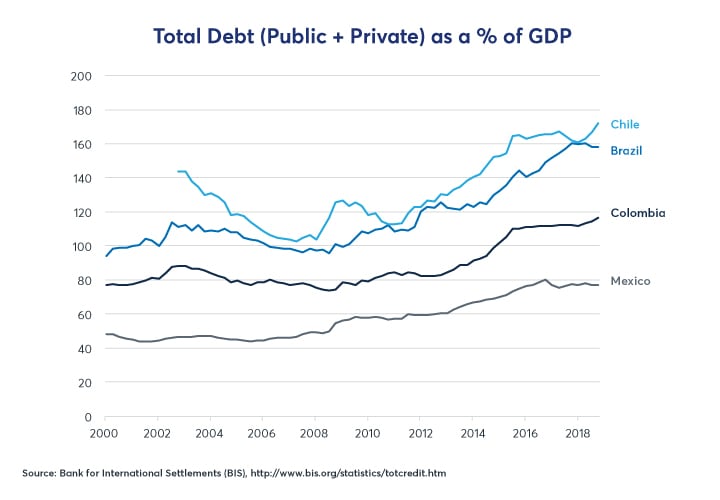
In that regard, Mexico’s uniqueness in Latin America isn’t simply a fact of its strong industrial base, economic proximity to the US and its lack of reliance on commodities. Mexico has among the world’s lowest levels of public and private-sector debt. This may prove to be Mexico’s trump card when dealing with an economic downturn. It could simply loosen fiscal and credit conditions, enabling the public and private sectors to borrow more. With extremely low levels of debt, Mexico’s economy may prove to be comparatively easy to stimulate with credit creation.
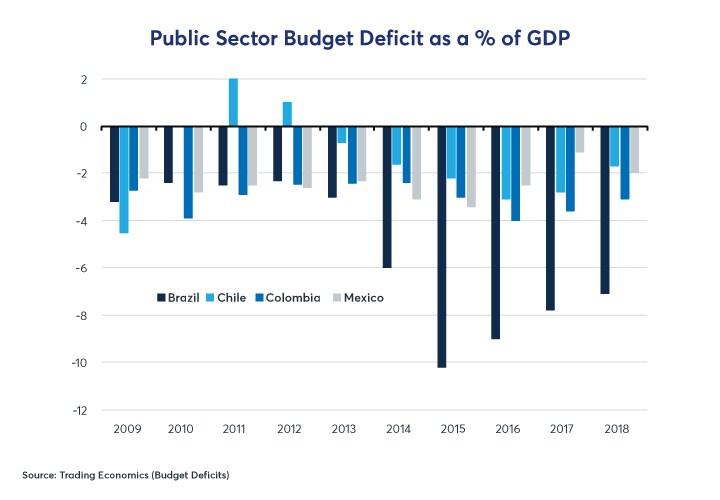
This contrasts sharply with much higher levels of debt in Colombia and especially Chile and Brazil (Figure 17). Chile can afford to have high levels of debt because its interest rates are low (the government borrows at between 1.5% and 2.4%, depending on maturity) and local currency loans of up to 10 years are not uncommon. This contrasts sharply with Brazil, where local currency loans of over three years are nearly unheard of and the government borrows at rates of 5.5-6.5%. The real rallied early in the summer on hopes that pension reforms would rein in Brazil’s massive budget deficits (Figure 18), but deficits could remain high for years to come, especially if export growth is slow or negative.
Overall, the early 2020s look to be a difficult time in Latin America as the region struggles with slow and, in some cases, negative rates of growth. The likelihood of slower growth in China and the US could inhibit export growth across a wide range of products. Europe doesn’t seem likely to pick up the slack.
If export growth does weaken, Latin American nations do have the means of offsetting the negative impact on their economies. Unlike many of their counterparts up north, central banks in Brazil, Chile, Colombia and Mexico all have substantial latitude to ease policy by traditional means (lowering short-term interest rates). Mexico has a great deal of room to explore fiscal stimulus – something President Andres Manuel Lopez Obrador might embrace enthusiastically. Chile and Colombia also have some space to pursue fiscal stimulus as well. Such stimulus efforts are probably not advisable in Brazil, which is wagering that recent pension reforms will reduce budget deficits and restore investor confidence.
Fiscal and monetary easing would likely weaken their currencies versus USD. Weaker Chilean or Colombian pesos and a weaker Brazilian real won’t likely raise many eyebrows in Washington. A weaker Mexican peso, however, could create problems for Mexico, which runs a $125 billion-per-year trade surplus with the US. Renegotiating NAFTA was meant to reduce the size of the trade gap but a downward move by MXN could easily offset the impact of the renegotiated trade treaty, which mostly made small changes to the existing trade pact. If political concerns prevent Mexico from allowing MXN to weaken in the face of a recession, it could potentially deepen and prolong the economic downturn.
Bottom Line
- Mexico has outperformed, until recently, by relying on strong US consumer demand.
- Brazil, Chile and Colombia depend on commodity exports and Chinese demand.
- Tight US and Mexican monetary policies might send Mexico into a recession.
- Brazil, Chile and Colombia growth might slow in late 2019 and early 2020.
- Slower growth in China, however, could threaten their export growth.
- All four nations have substantial latitude to ease monetary policy.
- Mexico also has room to ease fiscal policy as well, something that Brazil cannot easily do.
- A weaker Mexican peso could raise eyebrows in Washington.
-
Recommended For You
All examples in this report are hypothetical interpretations of situations and are used for explanation purposes only. The views in this report reflect solely those of the author(s) and not necessarily those of CME Group or its affiliated institutions. This report and the information herein should not be considered investment advice or the results of actual market experience.
Read original article: https://cattlemensharrison.com/latam-fx-high-flyer-mexico-to-fall-off-its-perch/
By: CME Group

