For the most part, middle-income countries did not have to rely exclusively on fiscal measures. With a few exceptions, such as Chile, interest rates in those nations remain above zero. As such, cutting interest rates, in many cases to record lows, also complemented their fiscal stimulus.
By contrast, interest rates in most high-income nations and regions such as the Eurozone, UK, Japan, Switzerland and Sweden were already close to zero as the pandemic began, or hit zero soon thereafter (Australia, Canada and the U.S.). As such, the higher-per-capita income countries have relied to a much greater extent on fiscal measures to counteract the negative impact of the pandemic. The size of the fiscal measures has varied from as little as 6% of GDP in Denmark to as much as 40% or more in Germany, Italy and Japan. For the moment, the U.S. holds the record in terms of outright spending at 25.5% of GDP, well above the 19% levels in New Zealand and the UK, the next two ranking nations in terms of direct fiscal support (Figure 2).
The sharp rise in debt levels is a global phenomenon and its long-term consequences have raised the interest of budget planners in numerous nations, including the United States. In March, the non-partisan Congressional Budget Office (CBO) released an assessment of the U.S. government’s long-term financial situation. The CBO projects that the U.S. budget deficit will shrink from 15% of GDP last year to 10% this year, and eventually settle at around 4% of GDP between 2024 and 2029. Longer term, the CBO projects deficits to grow from 2029 onward, with budget gaps widening to as much as 13.5% of GDP by 2050 (Figure 3).
The CBO’s deficit scenario would take the U.S. marketable public debt (excluding the part owned by the U.S. Social Security system, for example) from 102% of GDP, where it is today, to 202% of GDP by mid-century. As we have seen, the U.S. fiscal trajectory is hardly unique. In fact, even before the pandemic, Japan already had levels of debt that exceeded 200% of GDP. Moreover, many European nations as well as Canada are on a fiscal path that looks remarkably like that of the United States (Figure 4).
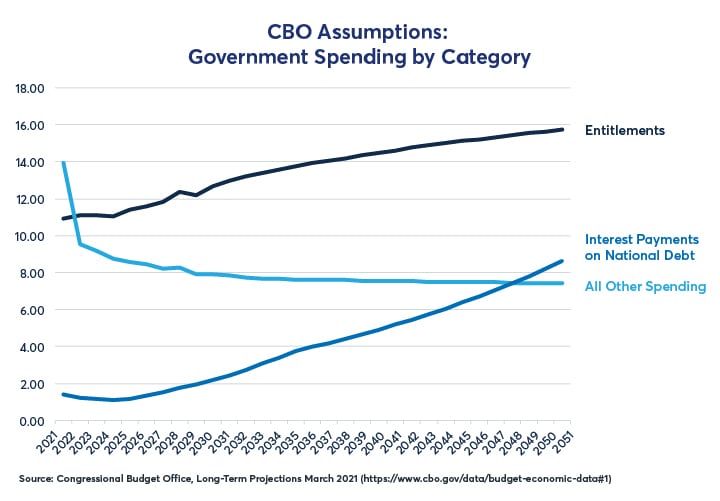
But should investors be concerned? The answer largely depends on the direction of interest rates. In the CBO’s scenario, discretionary spending, which is currently inflated due to COVID-19 relief measures, will shrink from 14% of GDP to below 8%. The shrinkage in discretionary spending will largely be offset, in the CBO’s view, by a rise in entitlement spending from 11% to 15.7% of GDP as the population ages and programs like Social Security, Medicare and Medicaid grow faster than the overall economy.
The main risk, in the eyes of the CBO, however, is interest payments. In the CBO’s view, interest on the national debt, which is expected to come in at 1.38% of GDP in 2021, will balloon to 8.6% of GDP (per year) by 2050 (Figure 5). Inherent in this assumption is the CBO’s view that the average interest rate (or bond yield) on the national debt will eventually rise to over 4% (Figure 6).
Although the CBO’s scenario is specific to the U.S., its message is universal. A rise in interest rates in Europe or Japan could create a similar expansion of public sector deficits and a similar rise in the overall level of public sector debt.
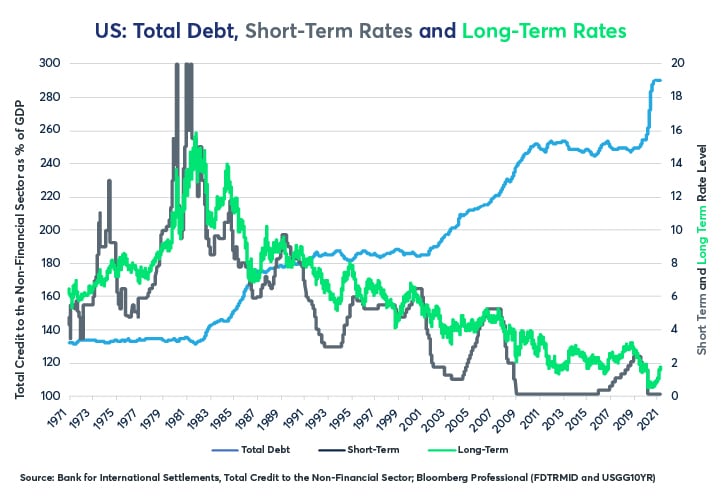
If the CBO scenario for interest rates turns out to be correct, it will represent a sharp departure from the trends of the past several decades. In the U.S., Japan and Western European nations, higher levels of debt have coincided, so far anyway, with ever lower interest rates. This isn’t to say that interest rates don’t occasionally fluctuate higher. Over the past 40 years, the Fed has had five major tightening cycles. There have also been some notable bond bear markets like those in 1994, 2003, 2013 and Q1 2021. None of these have so far reversed the downward trend in interest rates on a lasting basis. Moreover, this downward trend in short-term and long-term rates is a mirror image of the rise in the total level of U.S. debt, public and private (Figure 7).
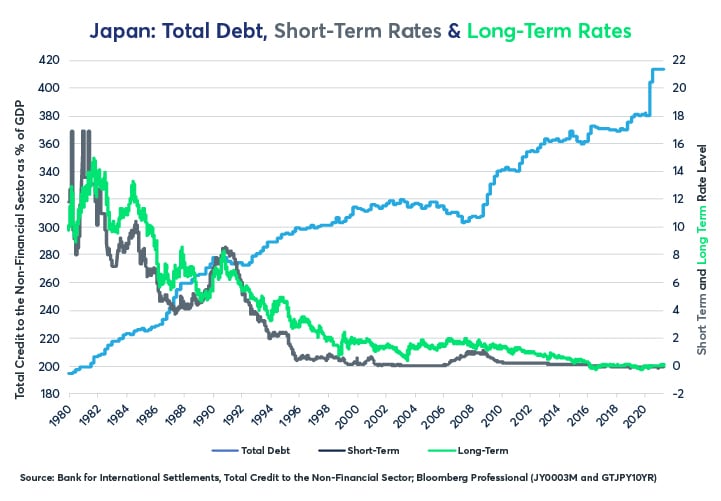
The U.S. is not the only country in the world with an inverse correlation between the level of debt and the level of short and long-term interest rates. When it comes to debt, Japan has been the canary in the coal mine, achieving extremely high debt ratios a decade earlier than Western nations. Japan’s public debt amounted to 235% of GDP as of the end of Q3 2020 — even higher than where the CBO projects U.S. debt levels to be in 2050. Yet despite – or perhaps because of — the extremely high debt burden, Japan’s interest rates are close to zero and the country finances its enormous public debt almost for free. Moreover, as Japan’s debt levels rose over the past 40 years, its interest rates, like those in the U.S. have fallen (Figure 8).
In past research we have observed similar phenomena across rich countries. As the total ratio of public and private sector debt has risen with respect to GDP, interest rates have tended to decline and then remain at low levels.
In addition to the historical evidence that high debt levels tend to depress interest rates, the market’s current prices don’t suggest that the CBO’s scenario is the most likely path of U.S. interest rates. As of mid-April, 10Y U.S. Treasury yielded 1.67% and the 30Y U.S. Treasury yielded 2.34%. From that, one can calculate the market’s pricing for the 20Y yield in 10 years’ time, which at the moment comes to about 2.67%. An average yield of 2.67% is substantially below where the CBO sees the rate to be in the 2030s and 2040s.
One could argue that current market pricing for 20-year Treasury yields in 10 years may not actually reflect where investors expect interest rates to be in the 2030s and 2040s. On the one hand, quantitative easing in the U.S. and abroad may understate where investors anticipate rates will be in the future. On the other hand, the term premium (the tendency for investors to charge higher yields on longer duration loans than on shorter duration loans) may overstate investor expectations for borrowing costs one, two- or three-decades away.
Given the possibility that the path of long-term rates could differ significantly from the CBO’s baseline projection, we examine two alternative scenarios and their implication for the size of the U.S. budget deficits and the overall level of U.S. debt. In these scenarios we hold the CBO’s other assumptions regarding GDP growth, spending and revenues constant, varying only the interest expense category. The purpose of the alternative scenarios is to examine how sensitive the assumptions for future budget deficits and debt-to-GDP ratios are to differing interest rate scenarios.
Alternative Scenario 1: Rates move in line with the April 15, 2021, U.S. forward curve.
Alternative Scenario 2: Rates remain near current levels (Figure 9).
Under scenario 1, U.S. deficits grow to 10% of GDP by 2050 rather than the 13.5% under the CBO’s scenario (Figure 10). In scenario 1, these seemingly modest annual differences in the size of the U.S. budget deficit result in a total level of marketable debt of 172% of GDP by 2050 rather than 202% under the CBO’s scenario (Figure 11).
Under scenario 2, if interest rates remain near current levels – a possibility suggested by the Japanese experience of the past few decades — deficits will grow towards 7.7% of GDP by 2050 and the overall level of marketable debt to GDP will rise to 138%, far below the 202% in the CBO’s scenario.
The bottom line is that the future course of deficit and debt levels in both the U.S. and abroad is highly dependent on what happens to interest rates. As the Japanese experience has taught us, extremely high levels of debt are sustainable on condition that borrowing costs remain sufficiently low.
Bottom line
- Countries around the world have engaged in unprecedented fiscal stimulus
- Fiscal stimulus has been larger as a share of GDP in high-income nations with near zero rates
- The CBO projects deficit and debt reaching high levels by 2050
- Different scenarios for interest rates can have a big impact on debt and deficit assumptions
-
Recommended For You
All examples in this report are hypothetical interpretations of situations and are used for explanation purposes only. The views in this report reflect solely those of the author(s) and not necessarily those of CME Group or its affiliated institutions. This report and the information herein should not be considered investment advice or the results of actual market experience.
Read original article: https://cattlemensharrison.com/interest-rates-and-high-debt/
By: CME Group


