Chart 1: US overtakes the Russians and Saudis to claim top spot

Southeast Asian crude oil benchmarks still fit for purpose?
The largest oil producers in Southeast Asia switched to using Dated Brent to price their crude oil exports in 2011-12 on the understanding that the North Sea marker would continue to reflect regional market fundamentals.
Malaysia, Indonesia, Australia, Vietnam and Brunei all made the switch to Dated Brent from either Malaysia’s Tapis or Indonesia’s Minas crude due to the declining availability of Minas and Tapis, which were increasingly divorced from market fundamentals.
The same issue of declining liquidity also now affects Dated Brent, which has a relatively small pool of buyers and sellers. Production in the North Sea is in decline. The number of cargoes that underpin the current Brent benchmark has fallen to around 900,000 barrels per day which is about one and half cargoes of 600,000 each per day, far below the output of other regions. The outage affecting the Forties pipeline system in December 2017 highlighted the risk of disruption given the low level of output.
Dated Brent is light sweet but its fundamentals are firmly anchored to the North Sea with little direct connection to Asia’s crude oil markets.
While the North Sea is in decline, US production is growing. In 2017, Malaysia imported around 45,000 barrels per day of US crude for the first time. The increase in crude supply from the US into Southeast Asia is increasing connectivity with the US markets and this may prompt a re-think of previous decisions around benchmarks. The relevance of US crudes for Asia is increasing and import volumes look set to rise in the coming years.
The changing quality of the North Sea?
Historically Brent has been considered a light sweet benchmark. But its quality has been falling since the introduction of Buzzard crude into the Forties stream in 2007. This becomes relevant because of the frequency with which Forties sets the price of Dated Brent. The mix of crudes in the North Sea is becoming heavier and sourer which reduces its attractiveness as an Asian benchmark.
Dated Brent developed as benchmark due to market logistics and free trade with cargoes shipped outside of the North Sea when economics permitted. A European Union free-trade agreement boosted the volume of Forties cargoes shipped to Asia, however it is not clear yet how this agreement would be impacted when the UK leaves the European Union.
The Brent price is established in London, which creates a misalignment to the Asian products which are set at 4.30pm local Singapore time. Whilst there is an “Asian Dated Brent price” this is rarely used in pricing meaning that refiners face significant timing dislocations between crude and products. On a typical trading day, the price of key refined products will be set several hours before the price of Brent may be known. If there were a markets issue that adversely affected the price of crude oil (or products) this could significantly alter the economics of any crack spread and thus the profitability of the refiner.
Southeast Asia remains a net exporter of crude
The most significant oil producers in the region are Australia, Indonesia, Malaysia, Vietnam and Brunei. Exports from the main Southeast Asian oil producers were around 900,000 barrels per day, based on a 5-year average, based on data from the US Energy Information Administration. The main producing companies in these countries made the switch away from regional benchmarks to Dated Brent in recent years. It is expected that despite the growth in refinery capacity, some of these countries are expected to remain net exporters of crude oil. Crude Oil production from Indonesia has fallen to below 1 million barrels per day since the mid-1990’s.
Malaysia and Vietnam are the largest net exporters with Brunei also classified as a net exporter due to the lack of refining capacity therefore, broadly all production is exported. Conversely, Australia and Indonesia look destined to become net importers of crude oil, partly due to the growth of their inland refinery demand coupled with falling production (see chart 2 – Crude Oil Production from Southeast Asia).
Chart 2: Southeast Asia Crude oil production
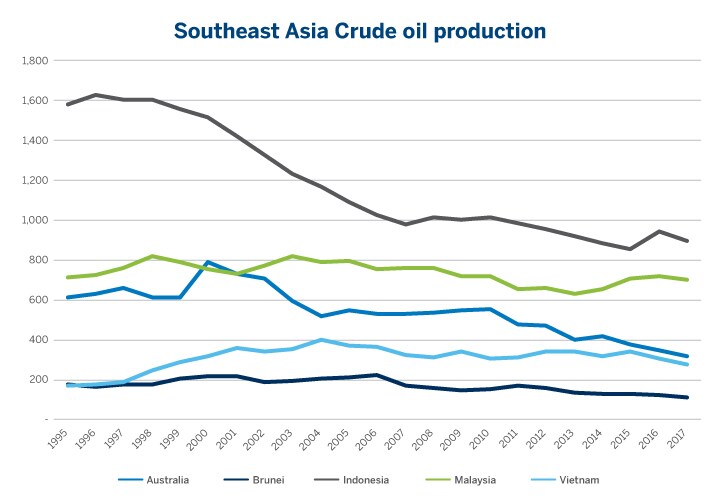
As the volume of crude oil produced in Southeast Asia continues to decline, producers are likely to divert output to domestic refining networks to satisfy growing regional demand for products.
There do not appear to be any valid light sweet regional crudes that could support a pricing benchmark, therefore regional producers have had to seek alternatives elsewhere. With a relative abundance of US light crude oil, could some of the US light sweet crudes fulfil this benchmark role?
US benchmark grows in significance for Asia
The decrease in regional production and a desire to diversify their sources of supply have led Asia’s refiners to turn to alternatives, often from the Americas.
Asia is a very significant consumer of oil and this position is only likely to strengthen as regional economies expand. Oil demand in China is the fastest growing of all the leading industrialised and non-industrialised economies. Based on a June 2018 report from the International Energy Agency (IEA), Chinese oil demand is estimated to have increased by 460,000 barrels per day in Q1 2018 vs Q1 2017 and April demand is likely to reach 495,000 barrels per day according to the IEA. At the end of 2018, the IEA forecasts that Chinese demand will be about 12.8 million barrels per day and a further gain to around 13 million barrels per day is forecast for 20191.
Imports of US based crudes have been rising in Asia to reach around 500,000 barrels per day. The Platts graphic below shows the increasing flow from the US to Asia.
With the US Crude Export ban being lifted and US Shale Production growing crude trade flows are rebalancing

US crude grades have been sold into 43 countries since the export ban was lifted. Asia has absorbed some of the largest volumes, reflecting the strong appetite of the region’s refiners for US oil. According to the May 2018 Chinese customs data, US crude imports were around 320,000 barrels per day over the first quarter of 2018 or 20% of total US crude oil exports over the period. S&P Global Platts noted that Chinese companies spent $2 billion on American crude oil in the first quarter of 2018.
A trade war with the US
In early July, the US imposed import tariffs of up to 25% on imported Chinese goods into the US. In a direct response, the Chinese have imposed import tariffs on a range of different US products but most significantly on US petroleum. Whilst it is too early to fully assess the impact that import tariffs will have, oil prices have fallen, partly in response. The fall in not yet significant enough to pressure the balance sheets of US producers with oil prices well above $70 per barrel and above the long run marginal cost. It is possible that US crude may become prohibitively expensive compared to alternative grades leaving US exporters seeking alternative outlets for US oil. It is not clear which producers would likely be able to fill the gap.
The prompt inter-month WTI spread has fallen significantly since early July, the effective date of the latest round of trade tariffs. Exchange data shows that the prompt WTI Futures spread has fallen by around $1 per barrel to $1.50 per barrel so the backwardation has lessened.
Regionally, Chinese refiners are watching developments with interest. A domestic refiner, Dongming Petrochemical Group with a processing capacity2 of 300,000 barrels per day announced that a cessation of US imported crude and they would turn to Iranian crude as a replacement. It remains to be seen if the Dongming decision is an isolated one or whether other refiners will follow suit.
The rising prominence of WTI has elevated its benchmark status. The US is arguably where the marginal price of crude oil is being established. The US has become very reflective of global supply/demand fundamentals. Both US and non-US markets are looking to WTI futures and the US grades markets for price direction.
US crude, the Asian solution to benchmarking?
Direct Asian participation in the major global energy benchmarks has never been higher. This trend is driven by a greater regional appetite for risk management and by the strong and growing energy connections between the U.S. and Asia-Pacific markets. With the growth of US crude in Asia, further changes are expected in the future when it comes to benchmarks. Further direct US price referencing in Asia may more closely reflect the supply/demand fundamentals of the market.
Specifically, for Southeast Asia, the debate around choosing the appropriate benchmark for crude oil may be re-evaluated given the prominence of US oil in the region. Whilst benchmark change is not straightforward nor is it a quick change, the enhanced role of the US in international crude pricing may bring about a change a little quicker.
1 IEA June Report – data table https://www.iea.org/media/omrreports/tables/2018-06-13.pdf
Neither futures trading nor swaps trading are suitable for all investors, and each involves the risk of loss. Swaps trading should only be undertaken by investors who are Eligible Contract Participants (ECPs) within the meaning of Section 1a(18) of the Commodity Exchange Act. Futures and swaps each are leveraged investments and, because only a percentage of a contract’s value is required to trade, it is possible to lose more than the amount of money deposited for either a futures or swaps position. Therefore, traders should only use funds that they can afford to lose without affecting their lifestyles and only a portion of those funds should be devoted to any one trade because traders cannot expect to profit on every trade.
CME Group, the Globe Logo, CME, Globex, E-Mini, CME Direct, CME DataMine and Chicago Mercantile Exchange are trademarks of Chicago Mercantile Exchange Inc. CBOT is a trademark of the Board of Trade of the City of Chicago, Inc. NYMEX is a trademark of New York Mercantile Exchange, Inc. COMEX is a trademark of Commodity Exchange, Inc. Standard & Poor’s, S&P®, Standard & Poor’s 500™, 500™, S&P 500 GICS Sector Indices™, are trademarks of The McGraw-Hill Companies, Inc. and have been licensed for use by Chicago Mercantile Exchange Inc. All other trademarks are the property of their respective owners.
The information within this communication has been compiled by CME Group for general purposes only. CME Group assumes no responsibility for any errors or omissions. Additionally, all examples in this communication are hypothetical situations, used for explanation purposes only, and should not be considered investment advice or the results of actual market experience. All matters pertaining to rules and specifications herein are made subject to and superseded by official CME, CBOT, NYMEX and COMEX rules. Current rules should be consulted in all cases concerning contract specifications.
Copyright © 2018 CME Group Inc. All rights reserved
Read original article: https://cattlemensharrison.com/impact-of-us-shale-on-asian-producers/
By: CME Group