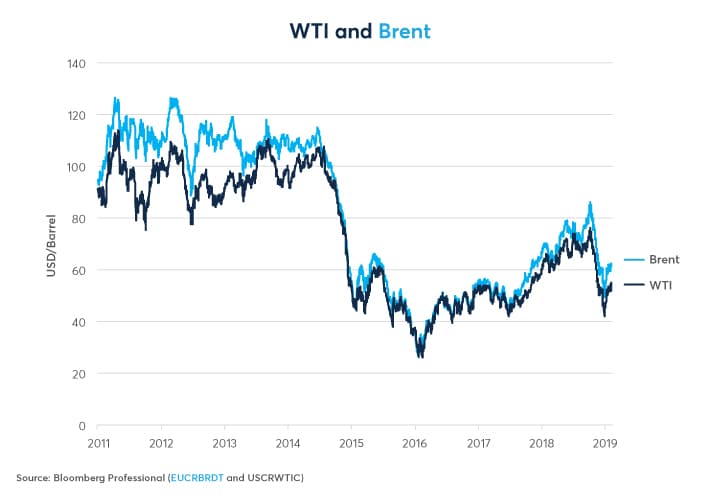
In the past two years, and especially in 2018, the Houston-Midland spread has become a reliable indicator of changes in the widely traded Brent-WTI spread (Figure 2). For example, in late January and early February 2018, the Houston price was trading just around $2 above the Midland price. The spread began widening until it peaked at around $19 in late May. The Brent-WTI spread followed suit but with a slight lag, peaking in early June. Both spreads narrowed sharply in June, but the Houston-Midland spread widened again, peaking in late September while the Brent-WTI spread followed with a lag, eventually cresting in late October. Since its September peak the Houston-Midland spread has been narrowing and so has the Brent-WTI differential, only more slowly. Houston-Midland appeared to lead Brent-WTI at times in late 2017 as well.
Economics Behind the Houston-Midland versus Brent-WTI phenomenon.
The economic reasons why the Houston-Midland price gap may be forerunning the Brent-WTI spread has a great deal to do with bottlenecks in the US. The U.S. shale boom has sent production surging to nearly 12 million barrels per day, up from about 5.5 million in 2007, transforming the world’s biggest net importer of oil into the world’s largest producer.
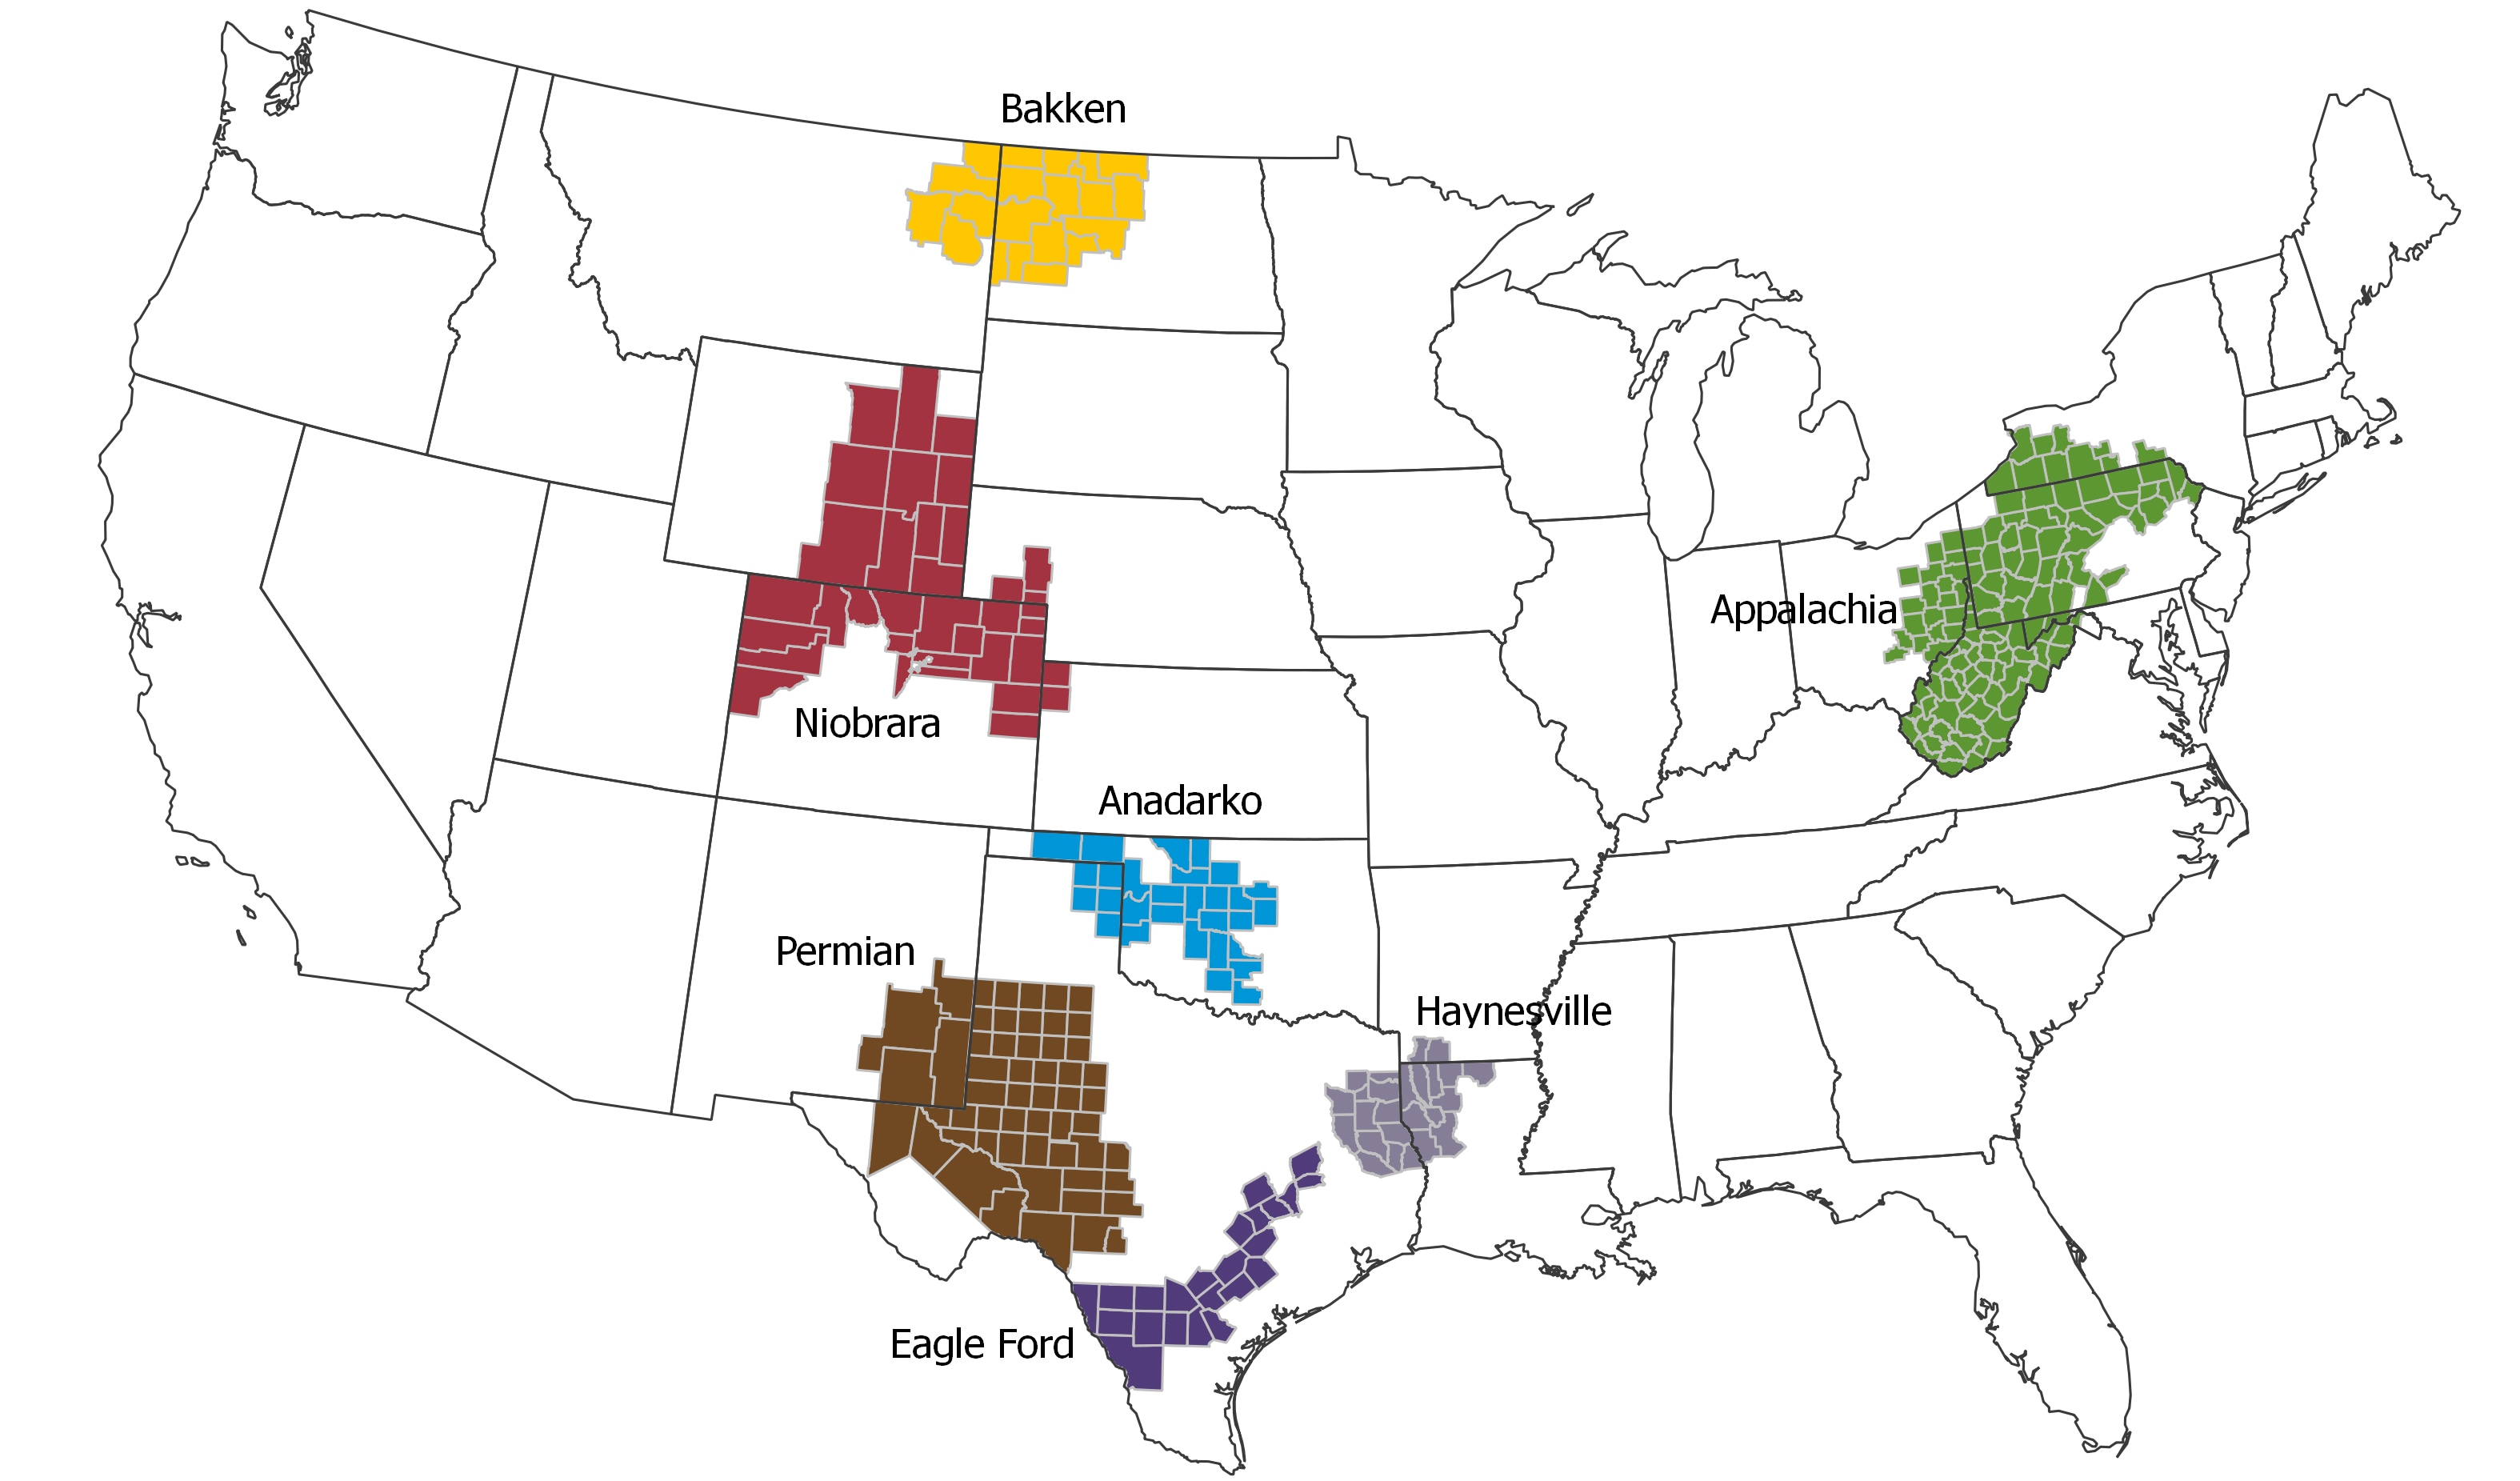
The U.S. domestic market is divided into seven production regions, several of which face bottlenecks in terms of getting their production shipped to the global market (Figure 3). Of the seven regions, two – Permian and Anadarko — are particularly important for domestic and global oil pricing, but for different reasons. Permian is important because it has become the de facto global swing producer and is the fastest growing production area in the US. It produces nearly 4 million barrels per day, about a third of total US output (Figure 4). Permian is the home of Midland, Texas, for which the WTI Midland contract is named.
Anadarko produces a more modest quantity, around 600,000 barrels per day, but is famous as the home of one of the world’s most important oil storage hubs: Cushing, Oklahoma. Cushing is the delivery point for the West Texas Intermediate crude oil contract. It’s also a repository for oil produced in other regions such as Bakken, Niobrara and Alberta, in addition to Permian basin oil.
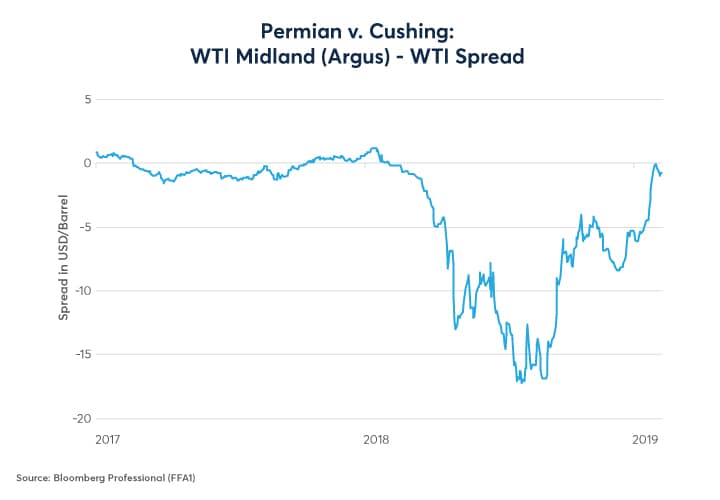
Permian production has often been outstripped by the ability of infrastructure to ship it to the market, leading its price to be depressed relative to the classic WTI price in Cushing (Figure 5). It costs only $0.80 per barrel to ship Midland (Permian) oil to Cushing and about $2 per barrel to send it to Houston via pipeline, but there isn’t enough pipeline capacity to ship it all. The other options are less economically attractive: $9 per barrel by rail to Houston and around $15 per barrel by truck.
Lastly, Houston is a major oil export point and WTI Houston, which reflects the price of afloat oil about to be shipped, moves more-or-less in lockstep with Brent (Figure 6). From Houston oil can be exported worldwide for roughly the same cost as oil from Brent’s historic production center in the North Sea. Exporting Brent through Europe, for example, costs around $1.20 per barrel. Shipping oil from Houston to Europe typically costs around $2.50 per barrel. As such, it’s not a surprise that the WTI Houston spread versus the classic WTI spread mirrors closely that of the Brent-WTI spread with a slight discount owing to marginally higher transportation costs.
Houston faces challenges of its own. U.S. production growth has outstripped the port’s ability to export the oil to markets outside of the U.S. but the Houston port is being expanded. Likewise, Permian production will likely begin reaching the port in Houston more easily as three new pipelines will open between September 2019 and January 2020 with a combined capacity of 2.07 million barrels per day –about half of Permian’s total production. These developments have the potential to bring Midland prices more closely in line with Cushing, and Cushing and Brent more closely in line as well.
For the moment, the market does not see the risk of a flood of U.S. oil coming onto the global market narrowing the WTI-Brent spread. Priced out to the end of 2021, markets anticipate the spread to stay at around $6 per barrel (Figure 7).
If Permian and other U.S. oil gets out through Houston more easily than the market anticipates because of debottlenecking, the spread could narrow more than the forward curve currently anticipates. Indeed, this is the scenario that the Houston-Midland spread suggests may likely occur if the spread continues to serve as a leading indicator of the Brent-WTI spread.
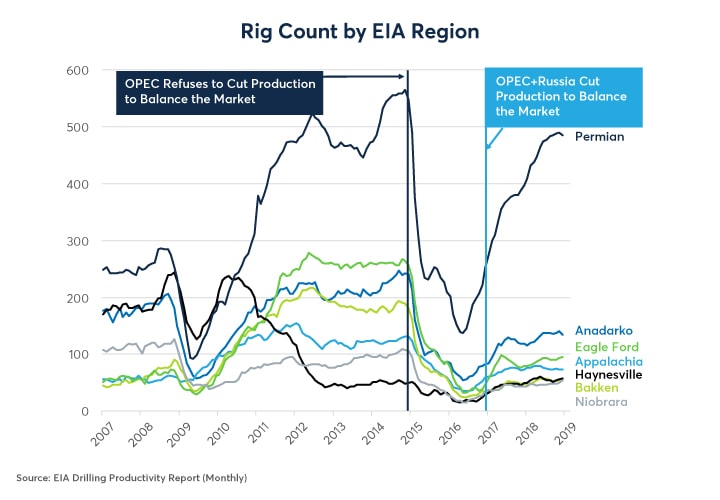
Brent-WTI could also narrow if U.S. production begins to decline. Permian production growth has slowed in recent months and the Q4 2018 drop in energy prices probably won’t help matters. Permian rig counts fell in January and those in other regions remain far below their 2011-14 levels (Figure 8).
Production costs in the Permian are lower than in other regions such as Anadarko, Bakken and Eagle Ford. The 70% crash in oil prices between November 2014 and February 2016 only slowed the Permian’s growth while it reversed growth in most other regions. The Q4 2018 crash in oil prices won’t be helpful to U.S. production levels going forward.
- Oil Production = Rig Counts x Productivity Per Rig
Rig counts are only part of the story. The 2014-16 price collapse coincided with a revolution in rig productivity (Figure 9). Even as rig counts collapsed, production levels only retreated modestly before surging anew after prices began to recover. Whether the Q4 2018 drop in oil prices leads to another surge in rig productivity is to be seen. What is clear is that U.S. production could grow much, much more, especially from Anadarko, Bakken, Eagle Ford and Niobrara, should oil prices rise to levels that incentivize increased production. The same could happen should there be a second rise in rig productivity.
Infrastructure also has a role to play. For example, it costs $6.50 to $7 to send Bakken oil to the U.S. East Coast or to Cushing by rail and $12 to get it to Houston by train. Infrastructure improvements that reduce these costs could increase the incentive to produce oil in Bakken and other regions as well.
Bottom line:
- Traders typically look at Houston and Midland prices vs Cushing.
- The Houston-Midland spread has been a decent leading indicator of Brent-WTI spread.
- Infrastructure improvements could “debottleneck” transportation amid U.S. oil exports.
- Brent-WTI forward curve does not anticipate any narrowing of spread.
- More efficient U.S. exports could potentially narrow the spread more than markets currently anticipate.
- Rig productivity appears to have plateaued.
- U.S. production could rise further if prices increase to levels that incentivize additional production from regions outside of the Permian, or as technology and infrastructure improve.
-
Recommended For You
All examples in this report are hypothetical interpretations of situations and are used for explanation purposes only. The views in this report reflect solely those of the author(s) and not necessarily those of CME Group or its affiliated institutions. This report and the information herein should not be considered investment advice or the results of actual market experience.
Read original article: https://cattlemensharrison.com/brent-wti-oil-spread-taking-cue-from-houston-midland/
By: CME Group


