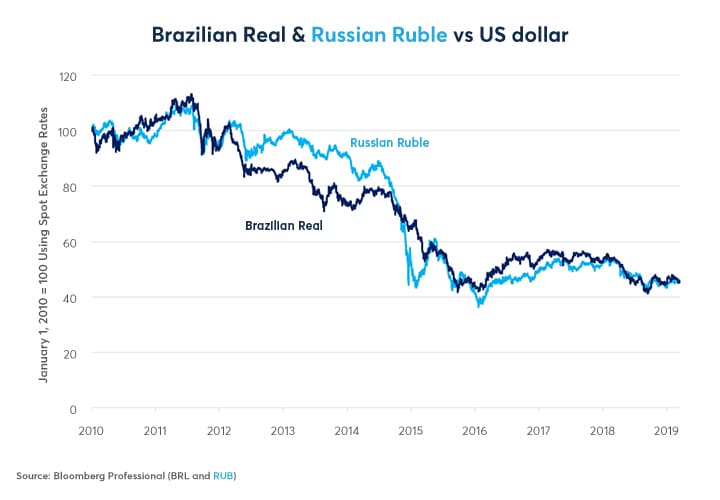
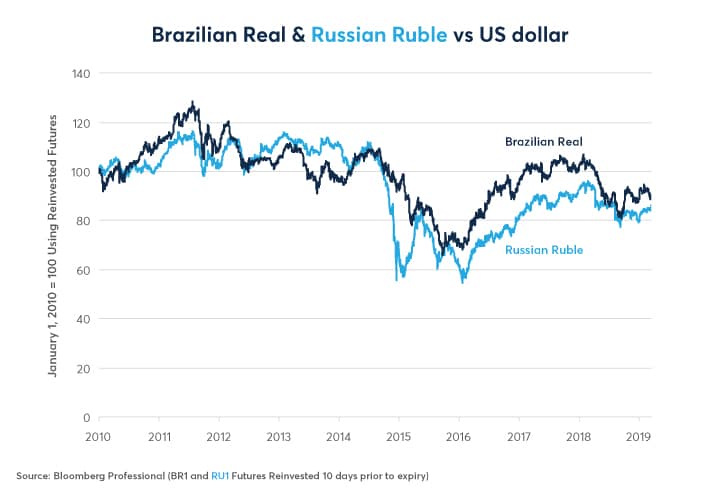
However, the evolution of spot prices doesn’t tell the whole story of currency movements because the spot price ignores the accumulated interest rate carried over. Brazilian and Russian short-term interest rates have averaged 7.7% and 6.9% higher than U.S. short-term rates, respectively. Even with the interest rate carried over being reinvested, BRL and RUB have turned in a remarkably similar performance so far this decade (Figure 2). In some respects, their similar performance is logical. Both nations are commodity exporters whose fortunes depend heavily on commodity prices. In other respects, however, their similar performance versus the dollar is surprising, given their radically different fiscal paths.
Diverging Fiscal Paths
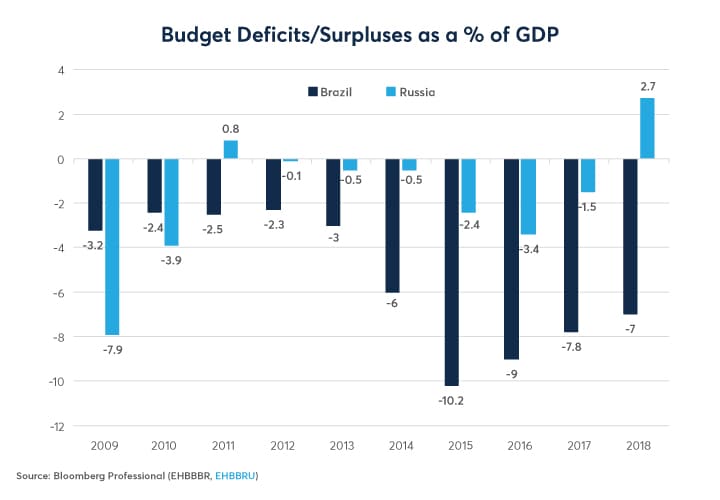
Russia has been on an ultra-conservative fiscal path. Since 2011, it has been alternating between small deficits and occasional surpluses. By contrast, Brazil ran mid-sized deficits from 2009 until 2013 before hemorrhaging red ink from 2014 (Figure 3). The result is that Brazil has an accumulated public-sector debt equivalent to 86% of GDP and that ratio is rising. In stark contrast, Russia’s public-sector debt totals 14.7% of GDP and is falling.
There is also a contrast in private-sector debt between the two countries. Russian private-sector debt amounts to 64% of GDP (17% household and 47% non-financial corporations), somewhat lower than Brazil’s 72% of GDP (28% households and 44% non-financial corporations).
Russian President Vladimir Putin convinced the legislature to enact unpopular pension reforms, raising the retirement age from 60 to 65 for men and 55 to 60 for women. These reforms sparked protests and the government gave some ground (the original proposal raised women’s retirement from 55 to 63) but nevertheless got the reforms through. What’s interesting is that Russia enacted the reforms while the government was in a strong fiscal position and wasn’t forced into it by a financial crisis.
Brazil’s situation could hardly be more different. Reforming Brazil’s overly generous pension systems for public workers is high up on President Jair Bolsonaro’s agenda. Unlike Putin, however, who’s United Russia Party commands a large majority (340 of 450 seats) in the Duma, Bolsonaro’s Social Liberal Party (PSL) controls only 52 out of 513 seats in Brazil’s lower house. To be fair, this somewhat understates Bolsonaro’s influence: he won 46% of the vote in the first round and 55% in the second round and has many allies among the other parties in the legislature. Nevertheless, getting pension reform legislation through and taking other steps to reduce the budget deficit, such as raising tax revenues, will be vastly more complicated than in Russia and will involve cross-party coalitions. Moreover, it involves taking on pension reforms not just for ordinary civil servants but also for the police and military, who are among Bolsonaro’s core supporters. So far, Bolsonaro’s early successes have mainly been symbolic. Investors are still waiting on the enactment of substantive reforms.
That said, surely currency markets are aware of the differences between Brazil and Russia’s debt levels, fiscal trajectory and political situations, so why do investors treat the two currencies in such a similar manner? There are several possible answers:
- Real optimism (perhaps unfounded) that Bolsonaro will achieve meaningful reforms.
- Ruble pessimism about the negative impact of sanctions against Russia.
- The influence of China and commodity prices: in other words, BRL and RUB’s fate is governed by forces bigger than domestic debt and politics.
In many respects, market reaction to Bolsonaro’s election as President is reminiscent of how investors reacted to Indian Prime Minister Narendra Modi’s election in 2014. The Indian rupee (INR) rallied strongly in anticipation of his win and remained strong for about two months after he took power. After that it was mostly downhill for INR as Modi delivered a mixed record reforms. The real could follow a similar pattern if Bolsonaro fails to deliver on key reforms and is unable to achieve the needed fiscal consolidation.
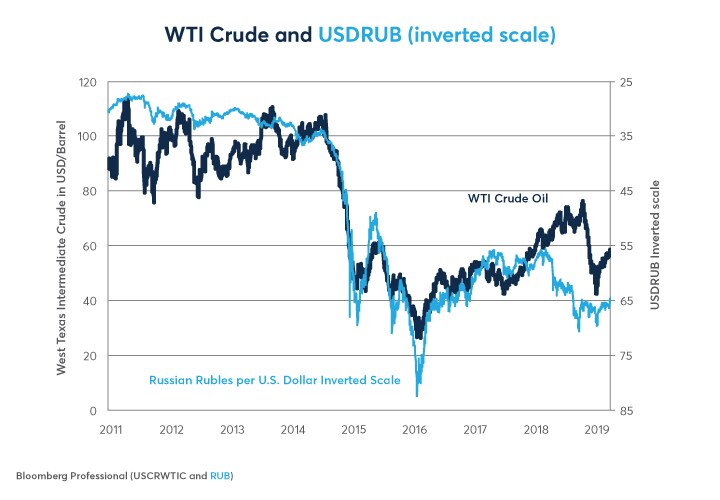
If investors are overly optimistic for what Bolsonaro might achieve in Brazil, they might be overly pessimistic regarding the Russian ruble. Despite, Russia’s robust fiscal health, the country does face long-term challenges: falling population and an extreme dependence on natural resources for export. Commodities account for 75% of Russia’s exports and oil alone is about 60%. Russia’s commodity dependence is easily evident by looking at oil prices and the ruble graphed side by side. From 2011 until 2017, they moved in lockstep (Figure 4). Since 2017, the ruble has underperformed, burdened by the pressure of EU and U.S. sanctions stemming from the Ukraine conflict and alleged election interference.
The good news about sanctions is that they are already in place and are unlikely to get worse – at least from the EU. If the EU was to begin easing sanctions, that could prove quite bullish for the ruble. The future course of U.S. sanctions policy is less clear. U.S. sanctions could pose a downside risk, however, if Washington was to enact tougher sanctions later this year.
Brazil’s currency also displays its own dependence on commodities. Although Brazil is a significant oil producer, it consumes most of what it produces domestically and is not a major net exporter. Oil exports account for about 10% of Brazil’s total exports. It is, however, a large exporter of industrial metals such as iron ore (20% of total), as well as crops such as soybeans and corn (36% of total).
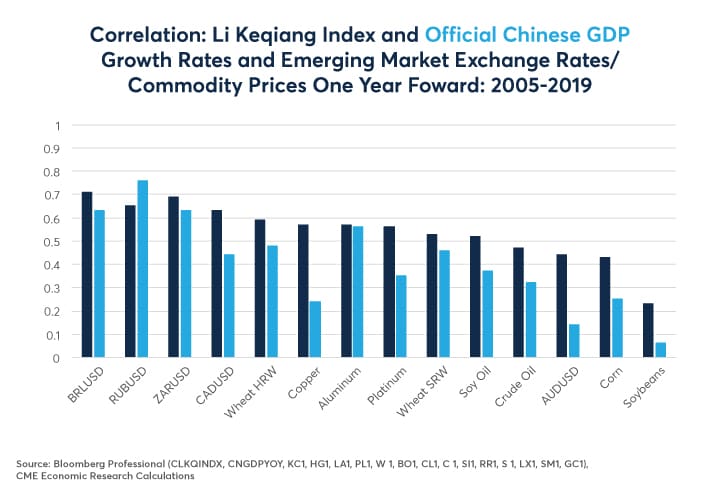
This helps to explain why, despite the extreme differences in the Brazilian and Russian domestic situations, the currencies move more-or-less in lockstep: they are responding to the same underlying driver of returns: global commodity prices. Commodity prices themselves are responding to a large extent to fluctuations in Chinese economic growth. As we have pointed out in past research, most commodities, including oil, industrial metals such as copper, and agricultural goods, have a strong correlation to a narrow measure of Chinese economic growth called the Li Keqiang Index, which measures the growth rates of Chinese electricity demand, rail freight volumes and bank loans (Figure 5). The same is true of the currencies of commodity exporting nations such as Brazil, Russia, Australia, Canada and South Africa.
One might argue that only 22% of Brazil’s exports and 11% of Russian exports head to China. That may be true but Chinese demand plays a large role in setting the global price in U.S. dollars for nearly every commodity, irrespective of who the ultimate buyer is.
To that end, Chinese stimulus measures are potentially good news for BRL and RUB. China is stoking its slowing economy by easing monetary and fiscal policies. So far this year, the People Bank of China has continued to slash its reserve requirement ratio while keeping interest rates at record lows. Meanwhile, the Chinese government announced that another tax cut will soon go into effect. All of this has steepened the Chinese yield curve which, over the past dozen years, has proven itself to be a fairly solid indicator of changes in the pace of China’s economic growth. China’s growth possibly picking up quickly in 2019 could boost both commodity prices as well as emerging market currencies such as BRL and RUB over the course of 2019 and 2020.
Looking deeper into the 2020s, however, BRL and RUB could be in for a challenging decade. Whatever the results of China’s short-term stimulus measures, the Chinese economy over the longer term could be beset by excessive levels of debt (which are being made worse by the short-term stimulus measures) and strong demographic headwinds. Debt and demographics bode poorly for commodity demand during the 2020s, especially due to abundant supplies, and for the real and ruble. That said, when differentiating between these otherwise similarly behaving currencies, Brazil’s fiscal trajectory worries us a great deal whereas Russia’s does not.
Bottom Line
- So far this decade, the real and the ruble have moved in lockstep.
- Yet Russia and Brazil’s fiscal and political situations could hardly be more different.
- Both nations depend to a great extent on commodity exports.
- Both currencies correlated strongly to the ebb and flow of Chinese demand.
-
Recommended For You
All examples in this report are hypothetical interpretations of situations and are used for explanation purposes only. The views in this report reflect solely those of the author(s) and not necessarily those of CME Group or its affiliated institutions. This report and the information herein should not be considered investment advice or the results of actual market experience.
Read original article: https://cattlemensharrison.com/brazil-and-russia-divergence-and-convergence/
By: CME Group

